June 1st, 2014
Indigo Books and Music reported its 4th quarter and annual sales last week. A few of the news stories reached for an alarmist tone. Canada’s Financial Post headlined its account with “Indigo annual revenue falls for third consecutive year.” Publishers Weekly went for the more startling “Indigo Has Big Fiscal 2014 Loss.” The “big loss” was $31 million (all figures Canadian dollars) on sales of $868 million, i.e. a loss of 3.6% measured against total revenue. Indigo clearly explained that it incurred costs in “reinventing its business.” The loss was in part “the result of significant operating investments in the Company to accelerate its transformation.” For example, $29.2 million was spent on store renovations and on technology, i.e. investments in the future of the company.
The annual report registers full year revenues of $868 million, against 2013 revenues of $879, a mere 1% drop. This is hardly the kind of financial data that characterizes a corporate crisis.
There’s only one small chart in the entire annual report that interests me. It’s the first chart I’ve seen from either Barnes & Noble or Indigo that puts a number on the decline of print sales within either chain.
 The real Indigo story is told in its Annual Information Form (available through the Investor Relations section of Indigo’s web site). The company notes, in part: “To ensure that the offerings in Indigo’s physical stores are rich and compelling, the Company continues to adjust and expand its product mix, underlining Indigo’s commitment to becoming the premier year-round gifting destination in Canada. The Company’s main growth categories are lifestyle, paper and toy sales. This has been achieved through a reduction in the floor space allotted to books, given the erosion of physical book sales…”
Yes, you read that correctly: Indigo plans to become “the premier year-round gifting destination in Canada.” That doesn’t sound like a bookstore to me.
This is in contrast to Barnes and Noble’s far more subdued description of its transformation. In its last annual report the company noted that it “continues to experience positive trends in its Toys & Games business as a result of the successful execution of new merchandising strategies.” Barnes & Noble is still a bookstore.
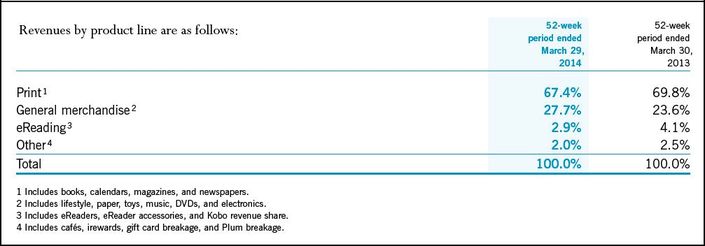
But look again at the chart above. Indigo offers no comparable figures before fiscal year 2013, but the decrease in sales the last 12 months of all print products was a mere 3.6%, from some 70% of the total down to 67.4%. With an estimated drop in revenue of $28.57 million, the decrease in print sales is 4.6%. It’s well documented that newsstand sales of magazines are plummeting. While magazines can’t be a large percentage of Indigo’s print sales, that trend suggests that book sales may have decreased by even less than 4.6%.
“General merchandise” — all of the non-book items — was rewarded with a 17% increase. This must be encouraging to Indigo management, but most of the uptake wasn’t at the expense of book sales.
Having sold off Kobo in 2012, the only growth area of its business (albeit, an expensive one to operate), “eReading” dropped by 41%, representing perhaps $25 million in total sales.
For all the talk of the reinvention of merchandising at both Indigo and Barnes & Noble, the first data suggests that, as is so often the case, change will be gradual.
August 7, 2014: The story above is nearly reversed in press coverage of Indigo’s Q1 2015 Report. The headlines focus on one small number to paint a cheerful picture: Indigo reports first growth in book sales since 2010 is typical. The Financial Post’s headline is on target: Indigo’s first-quarter sales get boost from gifts, American Girl.
It’s always good news when a book retailer reports improved sales. And it’s good news that book sales are up. But the details aren’t as rosy.
In the earnings call, asked for the details in the improvement in book sales, Indigo CEO Heather Reisman said “We don’t break it out.”
What is in the Q1 filing is a category call “Print”, consisting of “books, calendars, magazines, newspapers, and shipping revenue.” It increased by just .3% while decreasing from 71.5% of sales to 68.1% (although up slightly as a percentage from the full year figures above).
Indigo continues to lose ground, presumably to Amazon, in ebook sales. While Indigo reported that indigo.ca, grew by 14.0%, “eReading,” which “includes eReaders, eReader accessories, Kobo revenue share, and shipping revenue” dropped 40%, providing just 2.2% of company revenue, down from 3.8%.
——————————–
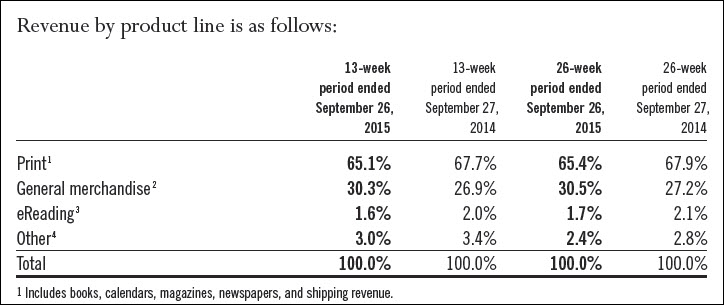
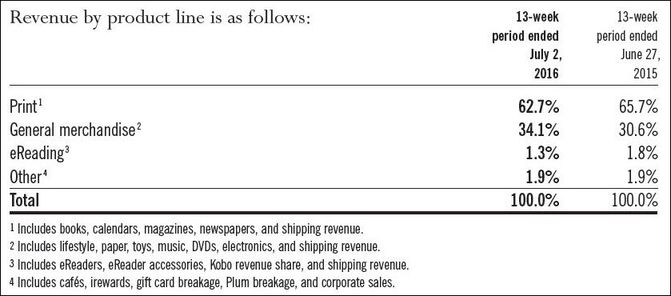
August 5, 2015. Updating the numbers. In its latest quarterly report, Indigo indicates that from the equivalent quarter last year, print declined from 68.1% to 65.7% of sales. Ereading declined from 2.2% to 1.9%. General merchandise increased from 27.4% to 30.6% of sales. The loss declined, but was still present, as it usually is. And, as Publishers Weekly reported, “Indigo is now up to four instore American Girl doll boutiques across Canada.”
November 3,2015. Here are the numbers from Indigo’s Q2 2015 report. Print sales as a percentage of the total decreased about 4% year-to-year, to 65.1% of the total. Ereading declined from 2.0% of sales to 1.6%.
February 3, 2016: The company reported excellent financial results for the quarter, sales up 12.9% and profits up about 60%. Book sales, they report “continued to be strong, with high single-digit growth in the quarter due to a combination of popular titles and a growing trend for adult colouring books.”
As you can see in the table below, print sales at Indigo have for the first time dropped below 60%, down from 69.8% in the 2013 fiscal year. That’s a 17% decline is print’s contribution to Indigo sales. Sales of “general merchandise” are up 27% in the same period. Ereading is down by two-thirds.

February 5: Publishers Weekly reports that “Despite Strong Q3, Indigo Downsized in January…. In spite of the strong numbers… it still opted to downsize in January. PW has learned that the Canadian retailer laid off roughly 20 staffers last month, including a number of veteran book buyers.”
May 31, 2016: Indigo reported its fourth quarter 2016 fiscal year sales, and they are excellent. Sales are up all over the place, in its small- and large-format stores and also online. Overall the sales increase was 11%. Fourth quarter data reveals an even more promising trend, with stores sales up in the 15% range.
The company reported that “revenue growth was driven by continued double-digit growth in the general merchandise business and high single-digit growth in the core book business, boosted by the trend for adult coloring books.”
However, print’s sha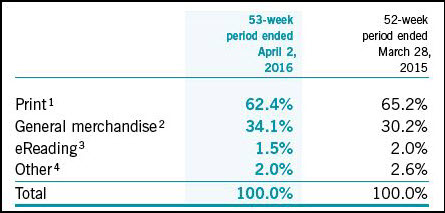 re of the product mix continues to fall on an annual basis, down to 62.4% of sales from 69.8% in 2013. eReading is down to 1.5% from 4.1%, despite overall online sales growth.
Still, with company sales of $994.2 million in 2016, against $892.5 in 2013, the total dollar volume of print sales is roughly equivalent, some $600 million.
Statistics Canada recently reported that the Canadian “book publishers industry” generated sales of $1.7 billion in 2014, of which English-language books represented 79.2% and French-language and other languages the remaining 20.8%. (This includes textbook publishers.) The U.S. Association of American Publishers estimates textbook sales at about 40% of total book sales. Assuming Indigo receives a discount averaging 50% on the books it sells, and that books are 90% of its print sales, Indigo has captured about 40% of the Canadian English-language trade book market. (How’s that for convoluted!)
 July 2, 2016: Indigo reported its Q1 2016 sales to this date. The overall indicators were solid. Overall sales were up 4.4%. Comparable stores about 7.7%. The net loss was $9 million, about the same as last year. The company said that sales growth “was driven mainly by the continued double digit growth of key general merchandise categories. On a comparable store basis, the Print business also experienced growth.” Sounds good, no?
But looking at the data that’s the focus of this article, print sales are down by 3 basis points, just over a 10% drop from the 2013 high of 69.8%. The percentage of sales from “general merchandise” have increased by 45% in that period.
And the other bad news: “eReading” has declined by two-thirds. At that level eReading brings in only $13 million/year (based on last year’s annual sales). If eReading offered the same percentage of sales as it did in 2013 that number would have be $41 million.
November 8, 2016: Sales are strong at Indigo, up 5.4%. Book sales are running at 63.1% of the total; eReading at 1.2%.
And what to make of this? Back in 2011 Indigo sold Kobo to Rakuten for $315 million (USD). As noted in its 2012 annual report, “Indigo received cash proceeds of US$146 million [46% of the total] on a 24-month investment of $32 million.” The company made it clear at the time that the sale “presented [them] with a very difficult decision.” While they were “hugely excited about the tremendous growth opportunity ahead” they could see the “oncoming headwinds presented by the demands of competing head-to-head against players with worldwide reach and endlessly deep pockets.”
As recently as 2015 Rakuten reported that they were continuing to lose money on Kobo. In February of this year it wrote down its Kobo investment for the third time, for a total of 44% of the purchase price (paywall). Would Indigo have performed any better?
It’s an easy question with a complex answer. Kobo’s revenue is a mix of hardware sales and content sales. Price competition (from Amazon, but also low-end players) makes profits in hardware near-impossible. Though hardware tends to bind customers for content sales. The margin on ebooks is solid, 30% and up, depending on the publisher, and the business scales well (selling the 100oth copy of a title is no more costly than selling the 10th).
Certainly Barnes & Noble’s nightmare experience with the Nook suggests that competing with Amazon is a fool’s game.
By selling Kobo Indigo abdicated its dominant position in the Canadian market, a publishing market worth 10% of the U.S. market, give or take (it’s still strong, but Amazon continues to grow at its expense). Kobo has also secured a solid spot as the third player, behind Amazon and Apple, but ahead of Barnes & Noble and Google Play. It has a singular focus on international ebook sales, which are more of an afterthought for Apple, though Amazon increases its market-specific initiatives, most recently launching Prime in India.
But Rakuten remains bullish: “Kobo is poised for a strong year this year [2016] both in terms of growth and continuing profitability improvement. In fact, in January we saw the strongest single-month content sales in our history while our device business is more profitable than ever.”
Here’s fiscal year 2017, announced May 30, 2017.
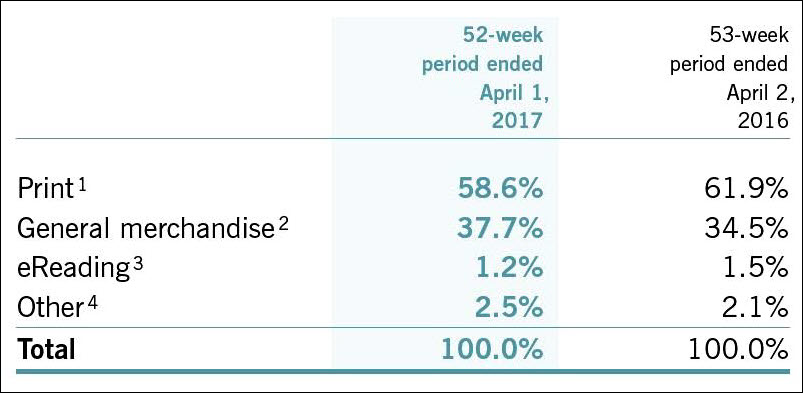
Print sales declined from 69.8% in 2013 to 58.6% in 2017. They were at 59.1% in the first quarter of FY 2017, 58.7% in Q2 2017.
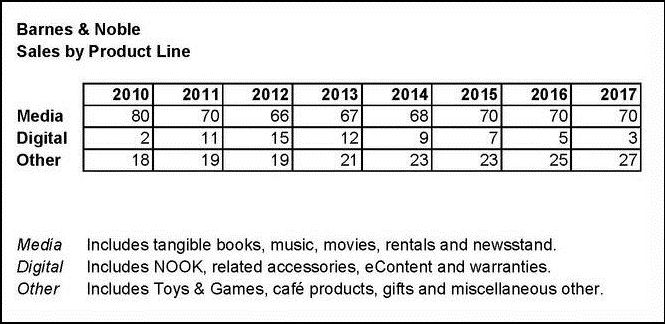
Here’s the similar data for Barnes & Noble from 2010-2017. The largest shift is in “Digital”, which is Nook hardware and digital content. This peaked at 15% in 2012 and has dropped steadily since. (For Indigo “eReading” peaked at 4.1% in 2013.) The Barnes & Noble college division was spun off in 2015 which skews the data in ways that are tough to judge.
February 6, 2018: Indigo reported a blow-up holiday quarter, their largest ever, with sales up 8.2% (PDF). Sadly, book sales are down from 52.9% to 49.1% of total (from 69.8% in 2013), ereading from 1.2% to 0.5% (from 4.1% in 2013).
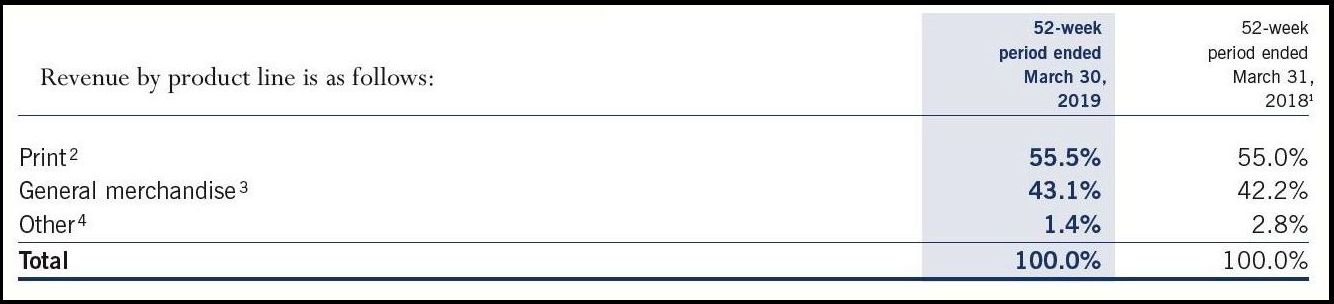
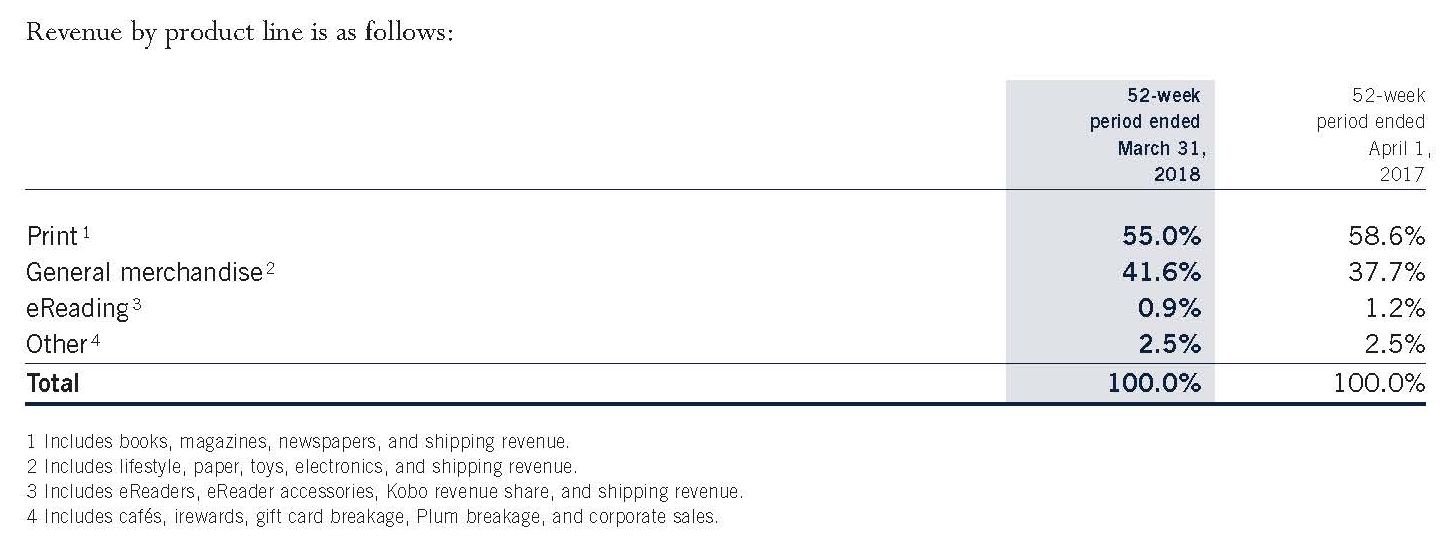
May 29, 2018: The FY 2018 data is in and book sales are now 55% of the total. Michael Cader at Publishers Marketplace brought to my attention that “Yes, the percentage has shifted steadily, which is notable — though maybe not as grim as you think, since what it really reflects is their rapid development of the “general merchandise”/lifestyle part of the business rather than a decline in books. Their total print *revenues* look pretty stable over the last five years:
$593m
$598m
$620m*
$583.5m
$587.5m
*53-week fiscal
August 7, 2018: Print sales at 57.6 percent versus 59.1 percent a year ago.
May 28, 2019: Book sales steady: